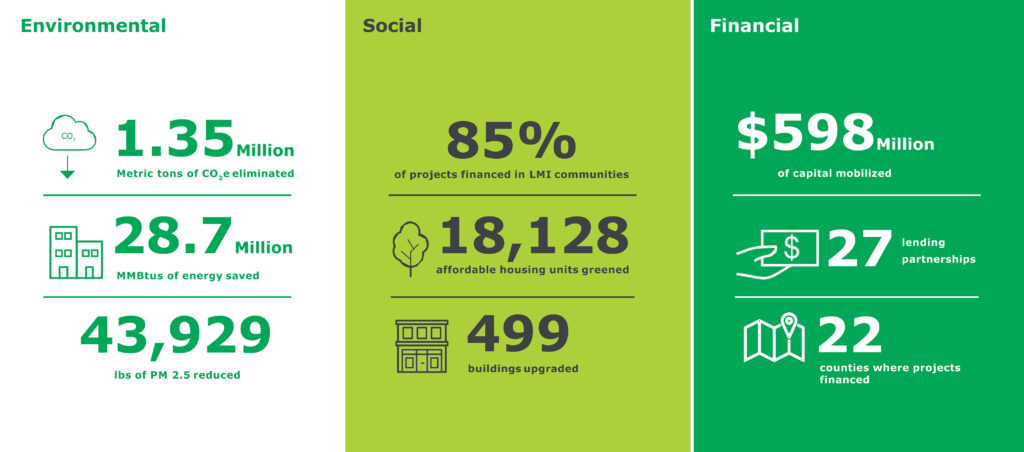
Our Impact

Source: NYCEEC estimates based on available data. As of March 31, 2025.
Source: Infographic figures are based on available data. Not all figures shown in the infographic include data for all projects (e.g., operating data associated with certain pre-development loans may be unavailable). Relationships between figures reflect these limitations. The figures shown in the infographic are revised periodically to reflect new projects and new data on existing projects (e.g., changes in project scope that produce upward or downward revisions). Environmental impacts based on estimates over project life; actual performance may vary. Additional considerations include: (a) greenhouse gas emissions based on EPA eGRID data and, in certain cases, projections of grid emissions factors from NREL or NYSERDA datasets; (b) MMBTU savings consider all energy commodities; (c) particulate matter (PM) 2.5 reductions consider site (not source) emissions; (d) buildings serving low- to moderate- income (LMI) communities are (i) designated affordable housing by an affordable housing agency or organization, (ii) located in an LMI census tract, and/or (iii) established primarily to serve residents of LMI communities; (e) affordable units greened equals total number of residential units at multifamily buildings serving LMI communities; (f) capital mobilized considers total project cost (or in certain cases, the proportion of total project cost attributed to energy efficiency or clean energy measures) financed in whole or in part by NYCEEC, as well as all or a portion (depending on the role) of total project costs of other projects facilitated by NYCEEC where it serves as an advisor or in another role; and, (g) lending partnerships include other co-lenders to projects where NYCEEC provides capital.
Total Impact Capital Estimated by Property Type
Total Impact Capital Estimated by Technology
Lending Philosophy
We focus 100% on energy efficiency and clean energy in communities.
There is huge untapped opportunity to invest in infrastructure supporting building decarbonization, distributed energy and storage, and electric vehicles. Private capital must be mobilized at scale to unlock this opportunity.
NYCEEC’s loans help organizations invest in energy efficiency and clean energy to improve human health, create jobs, save money, reduce adverse environmental impacts and build sustainable communities. We partner with financial institutions like Bank of America, Deutsche Bank, Enterprise, Fannie Mae, JPMorgan Chase, CDFIs and affordable housing agencies to build or expand clean energy financing markets. Our transformative market-based strategies can overcome barriers and scale investment.
We are a 501(c)(3) clean energy lender. We are based in New York City and lend throughout the northeast and mid-Atlantic region. Our focus includes high-impact areas like LMI communities, solar and storage, net zero energy buildings, and scalable products like C-PACE and predevelopment loans. Together with lending institutions, private sector solutions providers, policymakers and philanthropies, NYCEEC is working to support clean energy, infrastructure, and affordable housing.
